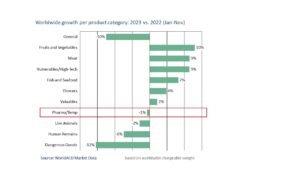
After achieving slow but consistent growth for several years, total airfreight pharma shipment tonnages globally were more or less flat in 2023 – although that’s a significantly better performance than the air cargo market as a whole, which declined by -5% last year.
Analysis by WorldACD Market Data highlights a number of interesting and significant trends underneath those overall global figures – including five ‘top 10’ origin cities for pharma air cargo that recorded double-digit percentage growth last year.
Analysis of the two million monthly transactions within WorldACD’s global database reveals that worldwide tonnages of ‘Pharma/Temp’ shipments – a category that includes pharmaceuticals and a small amount of other temperature-controlled cargo – fell by around -1% year on year (YoY) in the first 11 months of last year, whereas general cargo tonnages declined by around -10% compared with the previous year, underlining the relative stability of pharma shipment demand in times of economic instability.
To give this some broader and historical perspective, recent analysis by WorldACD revealed that Pharma/Temp tonnages YtD Nov 2023 were up by 11% compared with the equivalent period in the last pre-Covid year, 2019. Temperature-controlled pharma shipments make up around 4% of total air cargo tonnages, globally, and around 10% of worldwide Special Product tonnages – which, in turn, represent around 40% of the total market.
READ: Uncertain start to 2024
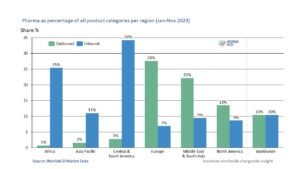
However, analysis by WorldACD highlights that Pharma/Temp shipments constitute a significantly higher proportion of traffic for some markets. For example, Pharma/Temp shipments form more than one third (34%) of inbound Special Products shipments to Central & South America and 25% of inbound Special Products shipments to Africa. On the outbound side, Pharma/Temp shipments represent 28% of outbound Special Products shipments from Europe and 22% from the Middle East & South Asia.
Double-digit growth for some markets
Regions recording significant changes in outbound pharma traffic last year include declines ex-Asia Pacific (-42%) and ex-North America (-12%), whereas there was growth of +18% from Middle East and South Asia, year-on-year. Significant changes on the inbound side include a drop of -9% to Europe, while there were increases to Middle East and South Asia (+5%) and North America (+3%).
Analysis by WorldACD also highlights significant directional imbalances in pharma traffic, especially for Africa (93% inbound, 7% outbound), Asia-Pacific (84% inbound, 16% outbound), Central & South America (72%, inbound, 28% outbound), and North America (61% inbound, 39%, outbound). But Europe is predominantly an export market for pharma air cargo shipments, with 78% outbound versus 22% inbound, whereas the Middle East & South Asia is a relatively balanced market, with 55% outbound and 45% inbound.
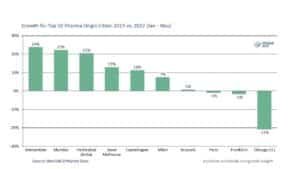
Among the top ten origin cities for pharma air cargo in 2023, five recorded double-digit percentage growth last year –Amsterdam (+24%), Mumbai (+22%), Hyderabad (+21%), Basel Mulhouse (+13%,) and Copenhagen (+11%) – with Milan also recording strong growth of +7%. (Slide 10). The only ‘top 10’ origin city to record a major decline last year was Chicago (-21%).
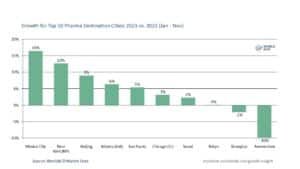
Among the top ten destination cities, Mexico City scored the biggest YoY percentage increase in the 11 months to November 2023, with a +16% rise – including a 41% increase in November alone. New York recorded a +13% increase, with significant increases also to Beijing ( +9%), Atlanta ( +6%), and São Paulo ( +5%). The only significant decrease among the top ten destination cities was Amsterdam (-10%).
Another interesting phenomenon highlighted by WorldACD’s data includes that the majority of pharma air cargo shipments are greater than 1000kg, based on chargeable weight, with 45% between 1000kg and 5000kg, and 38% of shipments greater than 5000kg. Those figures for YtD Nov 2023 are broadly similar to those in YtD Nov 2022.
READ: January tonnages well up on last year’s levels
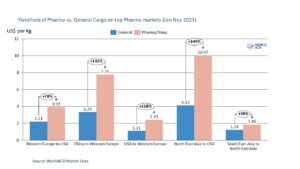
In terms of yield/rates, Pharma shipments tend to have significant differences compared to general cargo, that is, on specific trade lanes between Western Europe, North and South East Asia, as well as USA and China. For example, yield/rates for Pharma/Temp shipments from Western Europe to USA were as high as USD 3.93, compared to General Cargo yield/rates of USD 2.21 YtD Nov 2023. Similarly, rates for Pharma/Temp shipments from North East Asia showed double digit with USD 10 per kg figures in the same period, versus +4 USD per kg for general cargo shipments.

